Quantitative Particle Classification Analysis
.png)

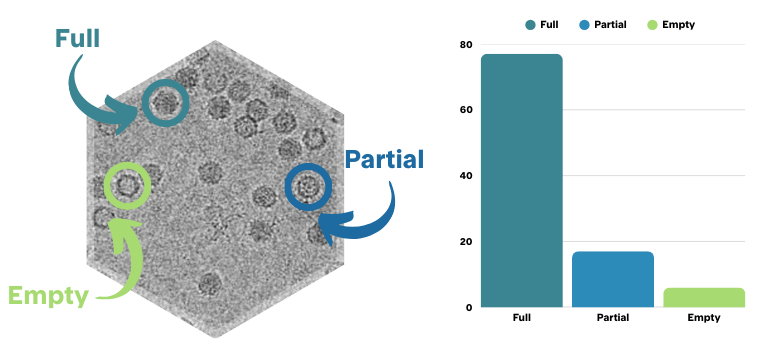
Detailed Insights into Particle Populations
Automated particle classification analysis of cryo-TEM images allows a deeper understanding of particle populations such as:
- Full/empty/partial capsid ratio analysis of AAV
- Percentage of blebbed particles in LNP formulations
- Prevalence of uni- & multilamellar, multicompartmental, and multivesicular liposomal particles
- Spatial distribution of antigens on virus or VLP particle surface
- How drug & nucleic acid payloads are distributed within formulations

Nanoparticles We Can Perform Particle Classification Analysis On

- Extracellular Vesicles & Exosomes
- Extracellular Vesicles & Exosomes

- Other Nanoparticle Samples
- Other Nanoparticle Samples
- Polymeric Nanoparticles
- Polymeric Nanoparticles
- Protein Based Nanoparticles
- Protein Based Nanoparticles
- Two Component Systems
- Two Component Systems

Visualize formulation characteristics on a per-particle basis with cryo-TEM direct imaging
Protein and lipid-based nanoparticles have been widely used in clinical applications, such as drug and gene delivery and vaccine development. Their unique physical and chemical properties at the nanoscale level have paved the way for various breakthroughs in medicine and healthcare. Characterizing the homogeneity of nanoparticles is crucial for ensuring their safety, efficacy, and performance in clinical settings.
Cryo-TEM imaging is a powerful technique used to directly visualize nanoparticles, such as liposomes and lipid nanoparticles (LNPs), viruses and virus like particles (VLPs), in their near-native state. This technique can evaluate the size, morphology, internal structure, and surface features of the nanoparticles. Therefore, cryo-TEM imaging is immensely valuable in categorizing nanoparticles based on specific properties of interest.
NIS provides the following types of fraction counting analysis services using cryo-TEM direct imaging and automated analysis of nanoparticles:
- Payload Location and Density
- Lamellarity Analysis
- Antigen Distribution
- Virus Maturation State
In the case of AAV, it is possible to determine the empty/full ratio of a formulation using automated image analysis. Please contact us to see an example report of our automated capsid ratio analysis.
Researchers work on optimizing the lamellarity of lipid nanoparticles to improve their performance as drug carriers. LNP and liposome lamellarity evaluation with cryo-TEM imaging is a valuable tool to differentiate between for example unilamellar, multilamellar, multicompartmental (or “blebbing” when looking at LNPs), and multivesicular particles.

Characterizing the antigen spatial distribution on the nanoparticle surface using cryo-TEM images into classes such as densely decorated, sparsely decorated, or no antigen decorated nanoparticles, can help optimize nanoparticle-based vaccine design. In addition, cryo-TEM imaging can also capture conformational variations of the surface-expressed antigens.

.png)
.png)
Frequently Asked Questions

Can I see an example report for your particle classification analysis?

How many particles do you count, or images do you analyze per sample or grid?