Advanced Cryo-TEM Image Analysis for Accurate Particle Sizing
Semi-automated particle contouring and sizing provides precise particle size distribution measurement for a wide range of samples:
- Liposomes & lipid nanoparticles (LNPs)
- Virus & virus-like particle formulations
- Iron nanoparticles, including dense core sizing


Samples We Can Perform Particle Size Distribution Analysis on

- Adeno-Associated Virus (AAV)
- Adeno-Associated Virus (AAV)

- Adenovirus
- Adenovirus

- Bacteriophage
- Bacteriophage

- Extracellular Vesicles & Exosomes
- Extracellular Vesicles & Exosomes
- Gold Nanoparticles
- Gold Nanoparticles

- Human Papillomavirus (HPV)
- Human Papillomavirus (HPV)

- Iron Nanoparticles
- Iron Nanoparticles
- Lentivirus
- Lentivirus

- Liposomes
- Liposomes
- Micelles
- Micelles
- Other Nanoparticle Samples
- Other Nanoparticle Samples
- Polymeric Nanoparticles
- Polymeric Nanoparticles
- Protein Based Nanoparticles
- Protein Based Nanoparticles
- Two Component Systems
- Two Component Systems
- Vesicular Stomatitis Virus (VSV)
- Vesicular Stomatitis Virus (VSV)

Particle size distribution analysis is an established procedure in many laboratories.
Assessment of the size distribution for particles in a given sample is an essential characterization step in pharmaceutical and biotechnology process validation & development, formulation development, and production. Particle size distribution is directly linked to many other product attributes and can affect their performance.
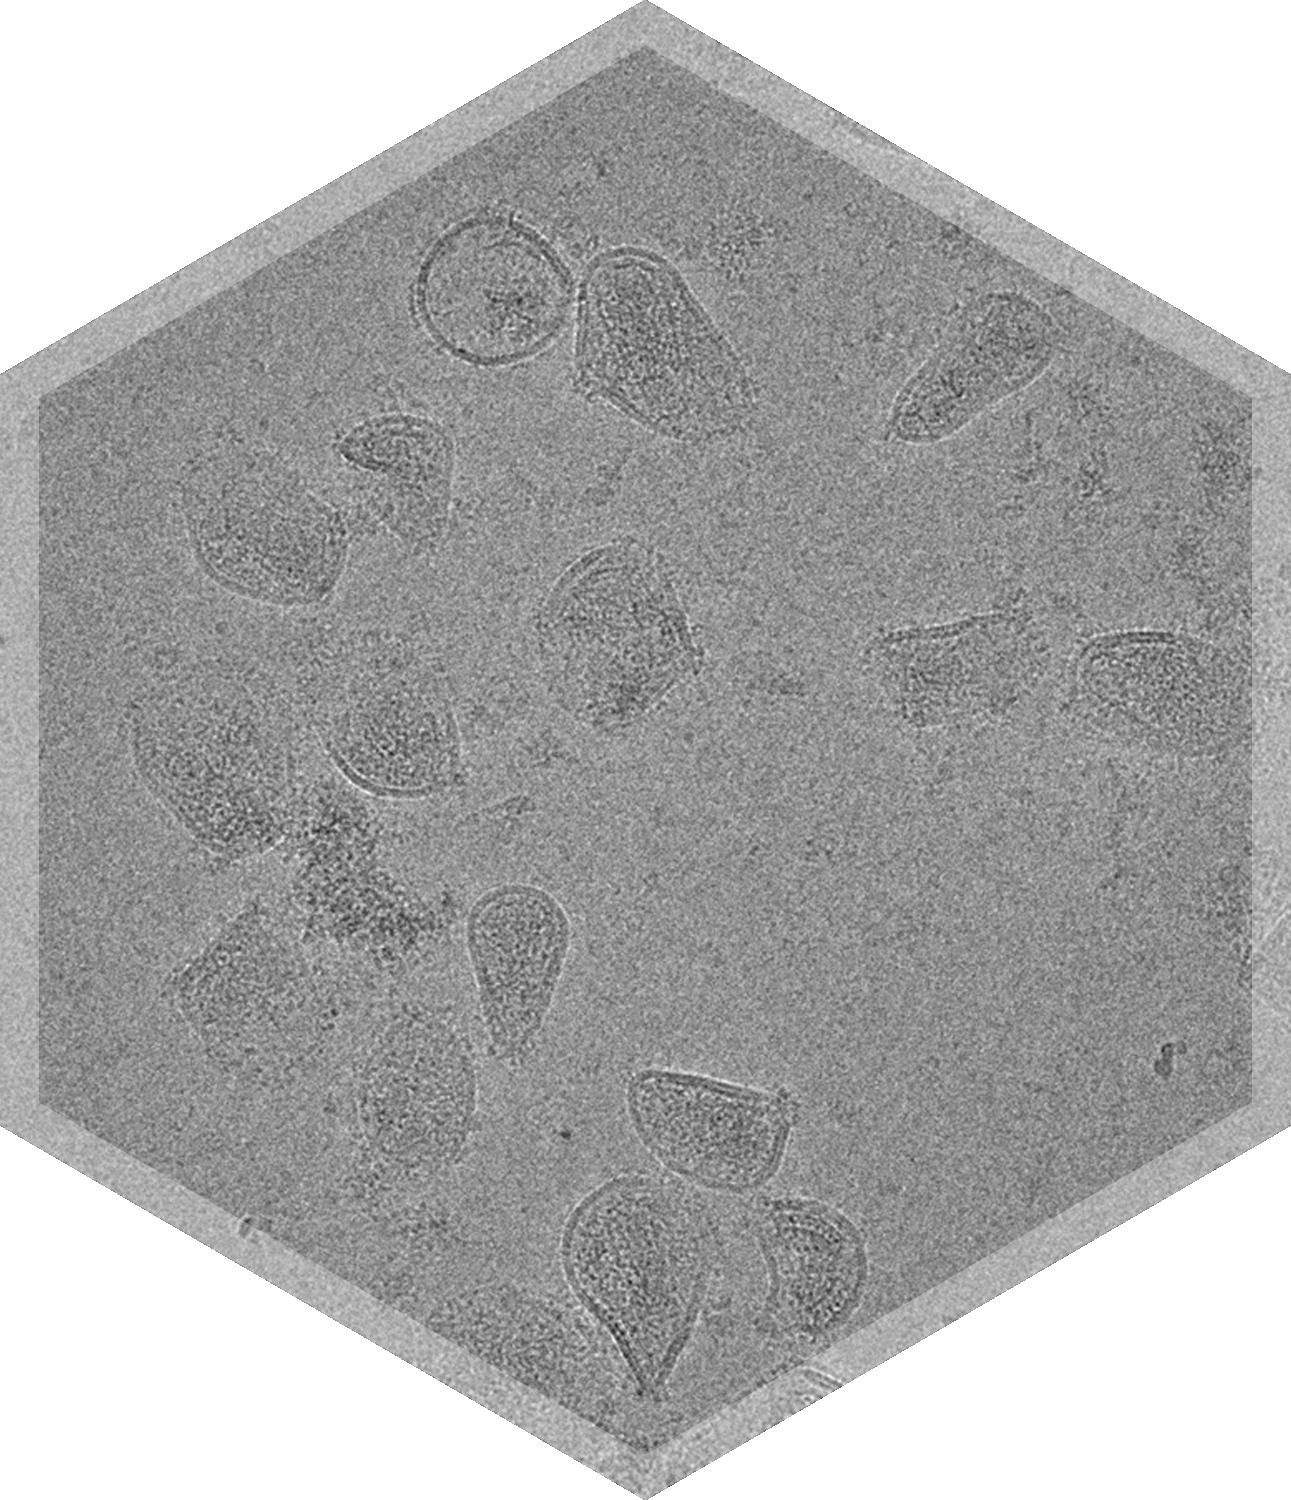
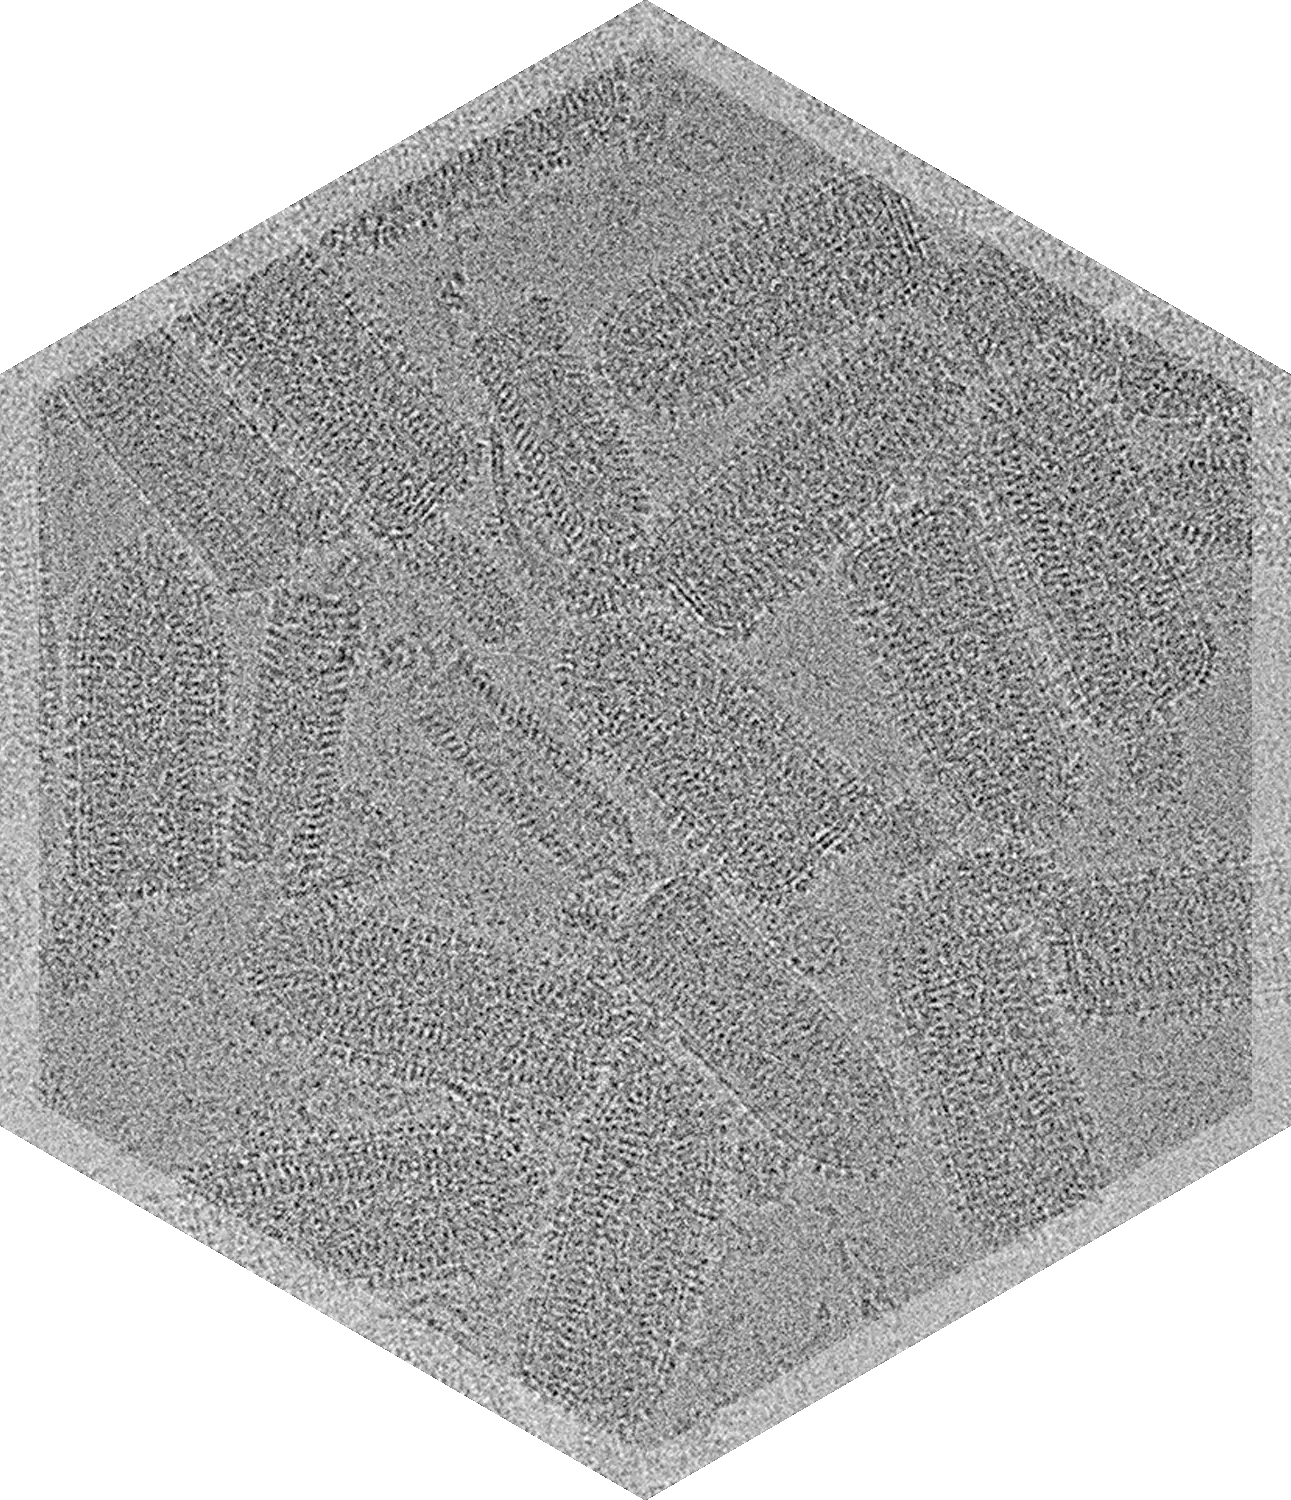
However, standard nanoparticle sizing methods can feature lengthy procedures and/or be prone to bias introduced by contaminants. We have developed advanced image analysis software for semi-automated particle contouring and sizing that provides precise particle size distribution measurement for nanometer to sub-micron particles in heterogeneous and homogeneous sample solutions. These analyses help answer questions regarding batch or lot similarities and consistency, biosimilarity, and to reconcile results from size measurements obtained via other methods. This service can be used with negative stain and cryo-TEM techniques.
We’ve performed size distribution analysis on nearly 800 samples (predominantly liposomal/lipid nanoparticles (LNPs); vaccine, virus or virus-like particle (VLP) samples; and 'other' samples such as iron sucrose, micelles, and more.) Particle size distribution analysis includes distribution curves, mean AED, mean/max Feret diameters.


Frequently Asked Questions

Can I see an example report for particle size distribution?

How many particles do you count, or images do you analyze per sample or grid?